New features in Efento Cloud
We are glad to inform you that we have recently added two new features to Efento Cloud: new type of PDF reports and the possibility to configure how the sensors should be displayed on the map. Both features are available to all our customers without any additional fees.
New type of PDF reports
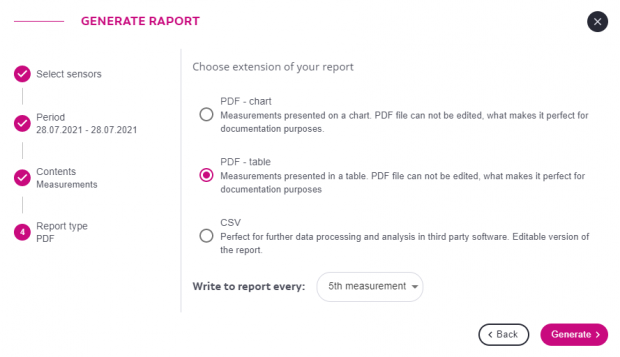
We have added a new additional type of PDF reports. You can now generate a report in PDF format as a table. Select the sensors,define the start and finish dates of the time range, from which the report will be generated, decide what your report will contain and choose the extension of your report as a “PDF – table”.

A PDF report with the measurements presented in a table will be generated and sent to your email address. PDF files can not be edited, which makes it perfect for documentation purposes.
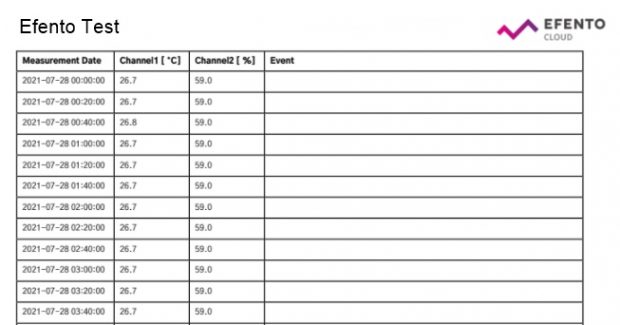
The example of the PDF report with table is presented below.

New options of displaying sensors on the ‘Location map’
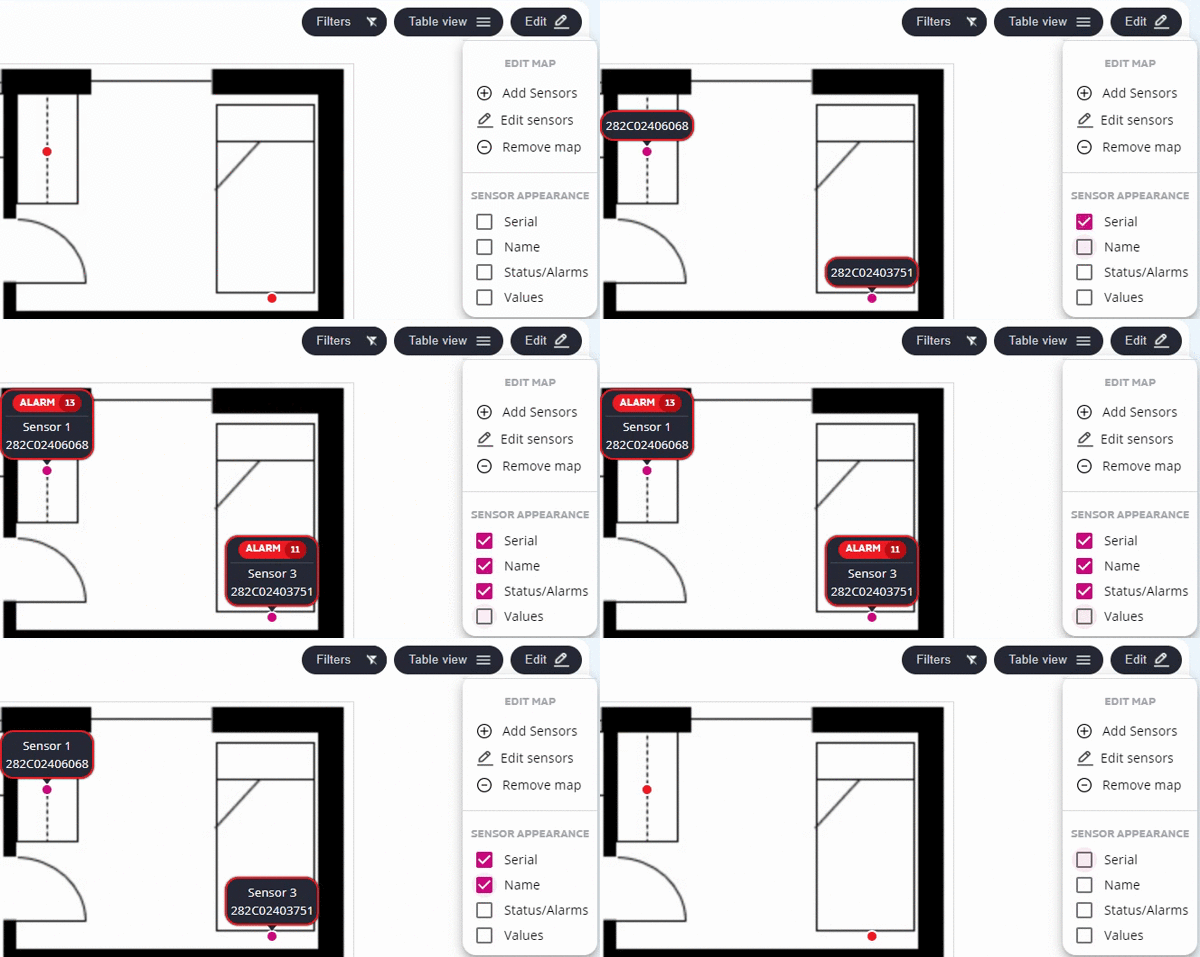
Up to now each sensor on the ‘Location map has been displayed with all information at the same time. Next to the dot which represents the sensor on the map,its name, serial number, status and the measurement values were displayed.
In the case of big organisations with a large number of sensors assigned to a single location the map would become hard to read, users could have problems finding the information which they were interested in.
From the last update each user of Efento Cloud has the possibility to decide which sensors’ information should be displayed on the map. To access the display settings click “Edit map” and tick the checkboxes next to the information you want to see.


